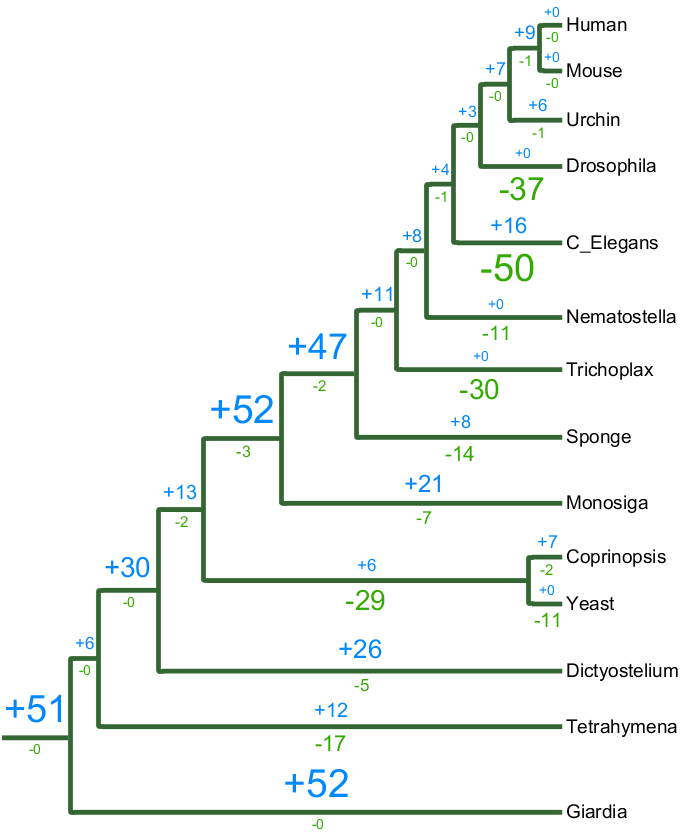
The tree below shows the distribution of kinase subfamilies across major phyla. Blue numbers indicate the number of subfamilies within a clade, and the black + and - numbers indicate birth and loss of subfamilies in each lineage. By this analysis, there were 53 distinct kinase functions in the early common ancestor of all these eukaryotes, and there has been much gain and loss since then. Most dramatically, the emergence of metazoans came with 76 new kinases classes, including the Tyrosine Kinase group; by contrast, yeast has lost 28 classes from its ancestral form.

The data underlying this graph is available in Excel or tab-delimited format. The tree is based on a parsimonious interpretation of the data, and kinases not within subfamilies ('-Unique') are not included. Some aspects of our classification scheme are in flux, and so these numbers will almost certainly change as that does.
This data is unpublished, so please contact us before reusing it. We do have an earlier work that links human kinases to those of yeast, worm, and fly models, and goes into more detail on their evolution:
Evolution of protein kinase signaling from yeast to man.* "Reprinted from Trends in Biochemical Sciences, Vol 27(10), G Manning, GD Plowman, T Hunter, S Sudarsanam, Evolution of protein kinase signaling from yeast to man, 514-520, Copyright (2002), with permission from Elsevier Science."
G Manning, GD Plowman, T Hunter, S Sudarsanam (2002)
Trends in Biochemical Sciences 27(10): 514-520. (PDF*)
